Image: Engadget
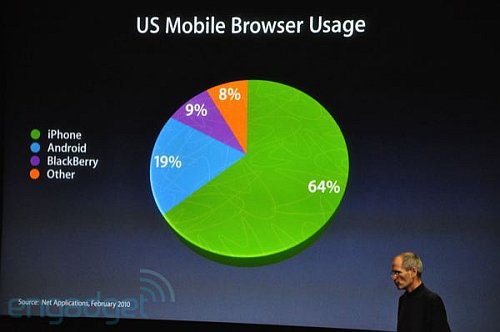
At the iPhone 4.0 SDK release announcement yesterday Steve Jobs made the claim that the iPhone has a 64% US Mobile Browser “User Share”. An accompanying slide showed shares for all mobile browsers as:
iPhone: 64%
Android: 19%
BlackBerry: 9%
Other: 8%
I’m skeptical of this number as it’s considerably higher than other estimates I’ve seen that put the iPhone’s share of mobile web traffic considerably lower.
The source for the slide is given as “Net Applications, Feb 2010“. Access to Net Application’s mobile web traffic reports requires a subscription, so I couldn’t follow up on the source. But I’ve seen similarly high iPhone share numbers from NetApplications in the past so I don’t doubt that the 64% number for the iPhone does appear in the Net Applications Feb report
Most other market share statistics put the combined iPhone and iPod share at around 50% or less. (I’m pretty sure the NetApplication’s iPhone numbers include the iPhone Touch as isn’t listed seperately.)
Statcounter‘s Feburary market share numbers:
iPhone + IPod: 50.63
Blackberry: 23.36
Android: 12.86
Other: 13.15
Incidentally StatCounter shows Apple’s share in rather steep decline over the last 6 months with RIM and Android both growing rapidly!
AdMob‘s (PDF) numbers for Feburary are:
iPhone + IPod: 44%
BlackBerry: 15%
Android: 12%*
Other: 29%
* AdMob doesn’t give a single figure for Android market share accoss all devices. 12% is the sum of the percentages for Motorola’s Droid and CLIQ and the HTC Dream, Hero, Magic and Droid Eris plus an estimated 1.1% for the Samsung Moment
Why the discreprancy and who’s right? I think the core problem is that NetApplications, Statcounter and AdMob aren’t actually measuring a representative sample of the traffic generated by mobile browsers.
NetApplications and StatCounter get their data from tracking software installed on (primarily desktop) web sites. Feature phone and BlackBerry browsers are underrepresented because they can’t handle many of the desktop sites that the iPhone and Android browsers can.
AdMob’s data comes from ad impressions generated on Admob partner’s mobile web sites and iPhone, Android, WebOS apps. In-app advertising is a major part of AdMobb’s current business model so again the iPhone and Android are overrepresented. I’m guessing that somewhere between 25 and 50 percent of AdMob’s Android and Apple traffic comes from apps. On the other hand, iPhone and Android users browse a lot of non-mobile sites that don’t carry AdMob ads.
My gut felling is that AdMob’s over reporting of app impressions more or less balances out it’s under reporting of Apple/Android traffic to desktop web sites and that AdMob’s statistics are the closest to the truth, at least for the US. StatCounter seems pretty good too, at least for Smartphones.
Another thing to consider is that all these statistics are US-only. Over 50% of AdMob’s traffic is from the US so the report’s worldwide numbers are heavily skewed by the US numbers.
My take, based largely on AdMob’s US numbers and StatCounter’s global chart, is that Apple drives about 44% of US mobile web traffic in the US and about 40% worldwide and that its share is in decline everywhere while RIM and Android are on the rise.
The global perspective is going to be much different. In particular Symbian drives a very significant portion of traffic almost everywhere except the US, Japan and South Korea. Feature phones running Opera Mini account for a lot of traffic from the developing world.
For a sightly different take on the accuracy of AdMob Statistics see Peter Paul Koch’s piece on QuirksMode.